
HVAC Design Optimization Based on Air Velocity Distribution
Air velocity within an occupied zone affects both comfort and thermal mixing.
ARTICLES
Wiratama
10/9/20253 min read
1. Introduction
In HVAC (Heating, Ventilation, and Air Conditioning) design, air velocity plays a vital role in determining thermal comfort, ventilation effectiveness, and energy performance within a building. While temperature and humidity are often the primary focus, the way air moves — its velocity distribution — directly influences how evenly conditioned air is delivered to occupants.
An optimized air velocity field ensures that fresh air reaches all areas efficiently without causing discomfort or drafts. Using Computational Fluid Dynamics (CFD), engineers can visualize and analyze velocity distribution to fine-tune diffuser placement, airflow rate, and duct design for maximum comfort and performance.
2. Understanding Air Velocity Distribution
Air velocity distribution refers to how the speed and direction of airflow vary throughout a room or building. It determines how effectively supply air mixes with the room air and how quickly heat and contaminants are removed.
Typical indoor air velocity targets:
Comfort zones: 0.1 – 0.25 m/s (ASHRAE 55 recommendation)
Below 0.1 m/s: Insufficient mixing, leading to thermal stratification.
Above 0.3 m/s: Draft discomfort for occupants.
A well-designed velocity distribution maintains a balance between air mixing and comfort, ensuring that supply air neither stagnates nor feels intrusive to occupants.
3. The Role of Air Velocity in HVAC Performance
Air velocity affects several key aspects of indoor environmental quality:
Thermal Comfort: Air movement influences perceived temperature; too much air movement causes a “drafty” feeling, while too little results in stuffiness.
Air Quality: Higher velocities enhance contaminant removal but can also resuspend particles if not properly controlled.
Energy Efficiency: Balanced velocity minimizes fan power consumption and avoids over-ventilation.
System Noise: Excessive velocity at diffusers or ducts can increase acoustic noise levels.
Hence, air velocity distribution becomes a core design parameter linking human comfort and HVAC energy performance.
4. Analyzing Air Velocity Using CFD Simulation
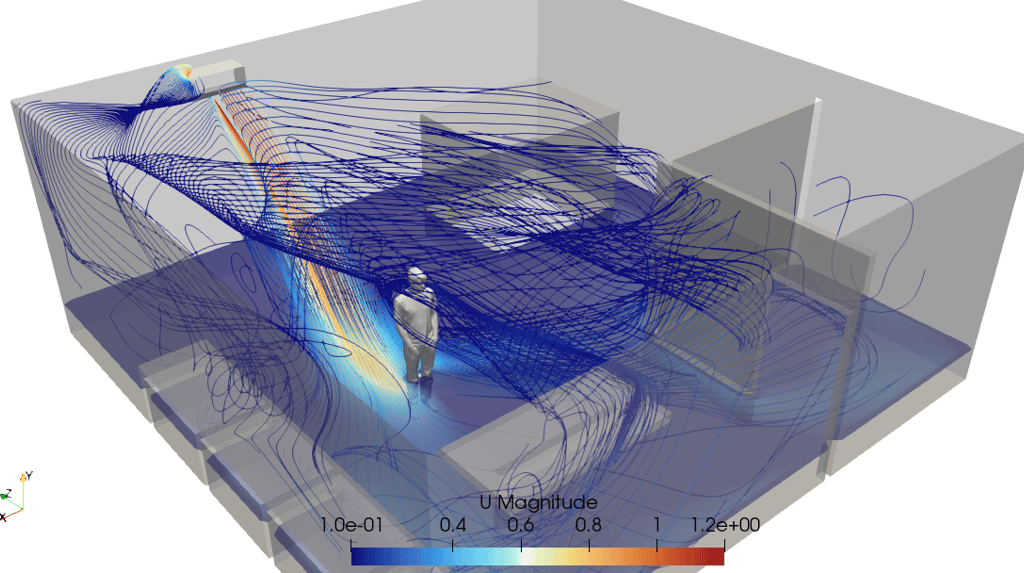
Computational Fluid Dynamics (CFD) allows designers to simulate 3D airflow inside a space, capturing both the magnitude and direction of air velocity vectors. The results are typically visualized as:
Vector plots showing flow direction and speed.
Color contours indicating high and low velocity zones.
Streamlines revealing recirculation or dead-air zones.
The airflow field is obtained by solving the Navier–Stokes equations for mass and momentum conservation.
By post-processing the results at the occupant height (1.1 m) or along specific cross-sections, engineers can evaluate how the airflow interacts with people and equipment.
5. Identifying Common Air Velocity Issues
CFD velocity plots help reveal airflow problems that may not be obvious in traditional HVAC calculations:
Recirculation zones: Air becomes trapped, reducing ventilation effectiveness.
Short-circuiting: Supply air exits too quickly through returns without mixing.
High-velocity jets: Excessive speed near diffusers causes drafts or noise.
Dead zones: Low velocity near corners or behind obstacles leads to temperature non-uniformity.
Detecting and resolving these issues early in the design process improves both comfort and system reliability.
6. Design Optimization Using Velocity Distribution
Once the velocity field is visualized, designers can apply targeted improvements:
Diffuser Orientation: Adjusting diffuser angle or type (e.g., swirl, slot, or perforated) to achieve even coverage.
Airflow Rate Adjustment: Fine-tuning supply volume to maintain comfortable airspeed in occupied zones.
Return Air Placement: Positioning returns to encourage circulation rather than short-circuiting.
Zonal Control: Balancing air velocity between high-load and low-load zones.
A well-optimized layout ensures that supply air diffuses smoothly, maintaining uniform comfort across all occupied regions.
7. Relationship Between Air Velocity and Comfort Indices
Air velocity directly influences Draft Rate (DR) and Predicted Mean Vote (PMV), two key thermal comfort metrics defined in ISO 7730 and ASHRAE 55.
High velocity increases DR, indicating greater likelihood of draft discomfort.
Velocity interacts with air temperature to determine PMV, which reflects perceived thermal sensation.
By analyzing velocity alongside DR and PMV maps, designers can balance comfort and efficiency with precision.
8. Practical Applications
Air velocity distribution analysis benefits a wide range of facilities:
Office buildings: Ensures comfort for seated occupants without drafts.
Data centers: Maintains uniform cooling air delivery across racks.
Cleanrooms: Provides laminar flow with minimal turbulence.
Hospitals and laboratories: Prevents cross-contamination and maintains sterile airflow.
Residential buildings: Balances comfort and quiet operation.
9. Conclusion
Air velocity distribution is a critical performance indicator in HVAC design. Beyond airflow rate and temperature control, understanding how air moves within a space determines whether the system delivers true comfort and efficiency.
Through CFD simulation, engineers can visualize airflow paths, detect dead zones or drafts, and optimize diffuser placement for even and comfortable air delivery. Designing HVAC systems based on air velocity distribution transforms traditional design into data-driven comfort engineering—ensuring that every occupant experiences consistent, clean, and comfortable air.
tensorHVAC-Pro
tensorHVAC-Pro is a software dedicated for indoor comfort and Air Quality of a HVAC system, designed for easy to use even for non simulation expert, focus on your project success.