HVAC Design Optimization Based on Draft Rate (DR) Distribution
Draft Rate (DR) predicts the percentage of occupants dissatisfied due to unwanted air movement and low temperature in localized zones.
ARTICLES
Wiratama
10/9/20254 min read
1. Introduction
In HVAC (Heating, Ventilation, and Air Conditioning) design, ensuring thermal comfort goes beyond controlling temperature and humidity. One of the most common causes of discomfort in indoor environments is the draft — an unwanted sensation of cool air movement across the skin.
To quantify this effect, engineers use a comfort parameter known as the Draft Rate (DR). Analyzing the DR distribution across a building provides valuable insight into how air velocity, temperature, and turbulence interact to affect occupant comfort. With Computational Fluid Dynamics (CFD), designers can visualize DR fields and optimize diffuser placement, supply air velocity, and airflow patterns to minimize discomfort and enhance indoor air quality.
2. What Is Draft Rate (DR)?
Draft Rate (DR) represents the percentage of people likely to feel discomfort due to air movement and low local temperature in a specific area.
It quantifies the risk of a draft sensation, particularly when cool air moves at relatively high speed within the occupied zone.
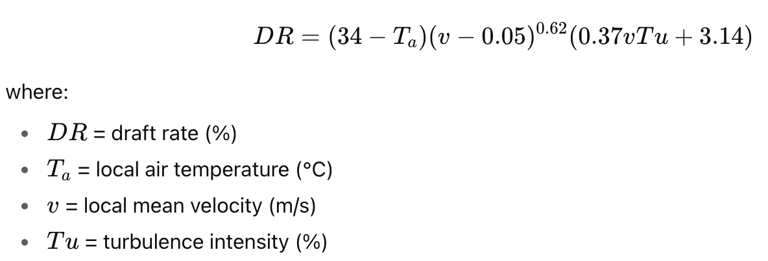
Mathematically, DR is defined as:
This formula, standardized in ISO 7730 and ASHRAE 55, captures how air speed, temperature, and fluctuating turbulence combine to create a cooling sensation that can make occupants uncomfortable.
3. Why DR Distribution Matters
Even in a thermally balanced room, uneven air movement can cause discomfort.
High DR values often occur near diffusers, windows, or doors where cold air jets or leakage occur.
Low DR zones may still feel stuffy if airflow is insufficient, but they rarely cause draft discomfort.
By examining DR distribution, engineers can identify where occupants are most likely to feel drafts and adjust the HVAC design accordingly. The goal is typically to maintain:
DR < 15% in the occupied zone → excellent comfort.
DR < 20% → acceptable comfort for most applications.
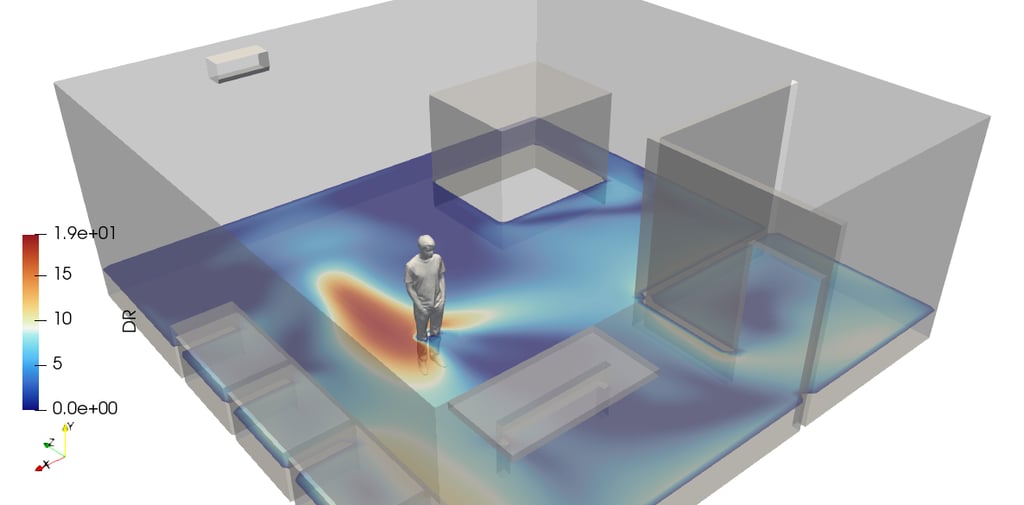
4. CFD Simulation for DR Analysis
Computational Fluid Dynamics (CFD) simulation provides a detailed method for evaluating DR distribution throughout a room. The CFD solver calculates local air velocity, temperature, and turbulence intensity — all of which are inputs to the DR formula.
The result is a 3D contour map showing zones of potential draft discomfort.
Typical patterns observed:
High DR near air diffusers → caused by high supply velocity or cold jets.
Moderate DR along windows → caused by cold surfaces or infiltration.
Low DR in central zones → ideal comfort region.
These maps are evaluated at occupant height (typically 1.1 m for seated persons and 1.7 m for standing) to represent actual thermal exposure conditions.
5. Factors Influencing Draft Rate
Several design parameters strongly affect DR distribution:
Supply Air Velocity – Higher velocities increase the likelihood of draft discomfort.
Air Temperature – Cooler supply air enhances the draft sensation.
Turbulence Intensity – Greater turbulence fluctuations amplify local cooling effects.
Diffuser Type and Direction – Poor diffuser selection or positioning can create cold jets.
Occupant Location – Workstations placed directly under diffusers are more exposed to drafts.
A balanced HVAC design must control all these variables simultaneously to minimize DR.
6. Using DR Distribution to Optimize HVAC Design
CFD analysis of DR distribution enables data-driven design improvements:
Diffuser Selection: Choose models that reduce jet velocity and improve air mixing.
Diffuser Orientation: Adjust the discharge angle to prevent air jets from impinging on occupants.
Air Supply Temperature Control: Slightly warmer supply air can significantly reduce draft risk.
Turbulence Management: Use flow straighteners or grilles to minimize turbulence intensity near occupants.
Zoning Strategy: Isolate high-airflow zones (e.g., near equipment) from occupied areas.
By optimizing these parameters, designers can maintain comfortable airflow while ensuring adequate ventilation effectiveness.
7. DR, PMV, and PPD Relationship
While PMV (Predicted Mean Vote) and PPD (Predicted Percentage of Dissatisfied) evaluate general thermal comfort, DR focuses specifically on local air motion discomfort.
A zone may have an acceptable PMV (e.g., near 0 for thermal neutrality) but still produce discomfort if DR is high. Thus, analyzing all three parameters together provides a complete picture of comfort performance:
PMV → overall thermal sensation.
PPD → predicted dissatisfaction percentage.
DR → local draft discomfort.
CFD post-processing tools can combine these fields, allowing engineers to visualize how DR correlates with air velocity and temperature gradients.
8. Practical Applications
DR distribution analysis plays a crucial role in various building types:
Office Buildings: Ensures comfort for seated occupants near supply vents.
Classrooms and Lecture Halls: Prevents cold airflow in student zones.
Hospitals and Laboratories: Maintains patient comfort while providing sterile airflow.
Cleanrooms: Balances laminar flow with acceptable comfort levels.
Residential Buildings: Avoids direct cold air impact from ceiling diffusers.
9. Conclusion
Draft Rate (DR) distribution provides a powerful, quantitative measure of occupant comfort related to air movement. By combining CFD analysis with HVAC design parameters, engineers can predict where drafts will occur and take corrective action before installation.
A well-optimized DR distribution ensures that airflow is fresh but gentle, maintaining thermal comfort while preventing local discomfort — a key factor in high-performance indoor environments.
Through advanced CFD visualization and analysis, HVAC systems can be fine-tuned not only for energy efficiency but also for precision comfort engineering, ensuring that occupants feel comfortable in every corner of the building.
tensorHVAC-Pro
tensorHVAC-Pro is a software dedicated for indoor comfort and Air Quality of a HVAC system, designed for easy to use even for non simulation expert, focus on your project success.