
HVAC Design Optimization Based on Predicted Mean Vote (PMV) Distribution
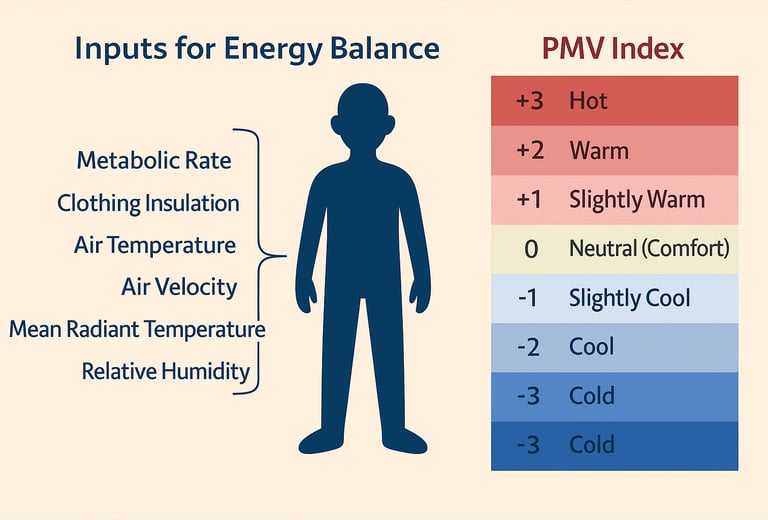
PMV estimates the average thermal sensation of a large group of people based on metabolic rate, clothing insulation, air temperature, mean radiant temperature, air velocity, and humidity.
ARTICLES
Wiratama
10/9/20253 min read

1. Introduction
Modern HVAC (Heating, Ventilation, and Air Conditioning) design focuses not only on maintaining target air temperature but also on ensuring overall thermal comfort for building occupants. Thermal comfort is influenced by several factors, including temperature, air velocity, humidity, clothing insulation, and metabolic activity.
One of the most comprehensive indicators to evaluate this comfort objectively is the Predicted Mean Vote (PMV). By analyzing PMV distribution, engineers can visualize how comfortable occupants will feel across a room or building and optimize HVAC parameters for uniform comfort. Using Computational Fluid Dynamics (CFD) simulation, PMV can be calculated spatially to create a three-dimensional map of comfort performance.
2. What Is Predicted Mean Vote (PMV)?
Predicted Mean Vote (PMV) is a standardized thermal comfort index that predicts the average thermal sensation of a large group of people in a given environment. It ranges from –3 (cold) to +3 (hot), where 0 represents thermal neutrality.
The PMV model was developed by Professor P.O. Fanger and is widely used in ISO 7730 and ASHRAE Standard 55 for assessing thermal environments in buildings.
3. PMV Equation and Parameters
PMV is calculated based on the heat balance between the human body and its environment, taking into account both environmental and personal factors.
Although complex, this model allows CFD post-processing tools to compute PMV at every grid point in the domain once air temperature, velocity, and humidity are known.
4. Why PMV Distribution Matters
While a single PMV value at a reference point provides limited insight, the spatial distribution of PMV across a room offers a complete picture of thermal comfort:
PMV > +0.5: occupants may feel too warm.
PMV < –0.5: occupants may feel too cool.
PMV between –0.5 and +0.5: considered the optimal comfort zone.
Visualizing PMV distribution helps identify:
Zones of overheating near solar-exposed areas.
Overcooled regions under diffusers or near air outlets.
Balanced comfort zones within the occupied area.
This allows engineers to fine-tune air supply conditions and diffuser layouts for uniform thermal satisfaction.
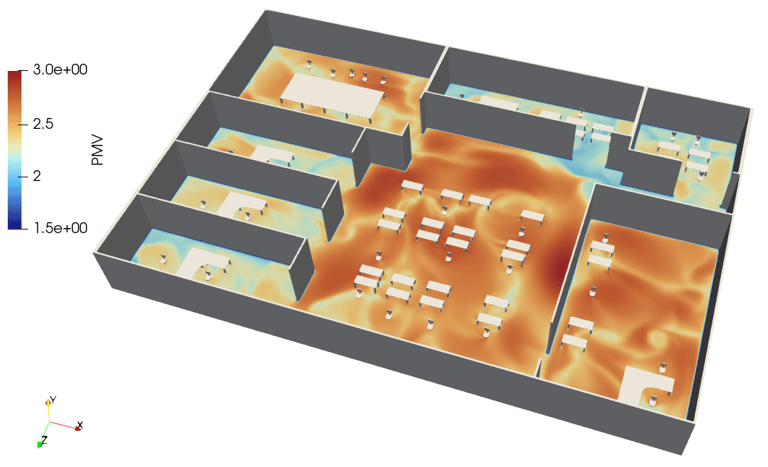
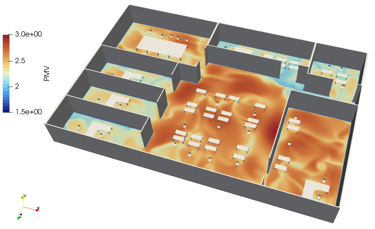
5. PMV Distribution Using CFD Simulation
With CFD simulation, it is possible to generate a 3D map of PMV values across the entire space. The simulation incorporates:
Air velocity and turbulence field.
Temperature and humidity distribution.
Radiation effects from surfaces.
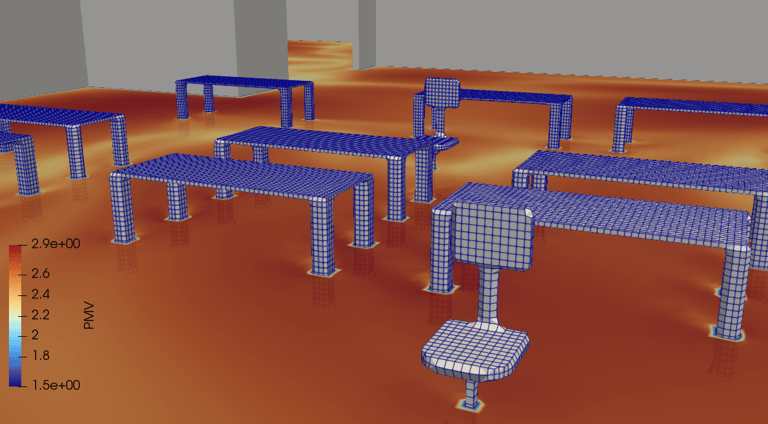
Post-processing software (such as those integrated with OpenFOAM, Cradle CFD, or MSC Marc) computes PMV values and displays them as contour plots or colored surfaces:
Blue regions: cooler sensation (negative PMV).
Red regions: warmer sensation (positive PMV).
Green zones: thermally neutral comfort areas.
This visualization enables a precise, occupant-level evaluation of comfort conditions under real HVAC operation scenarios.
6. Optimizing HVAC Design Based on PMV
By analyzing PMV distribution, engineers can make targeted improvements in design:
Adjust supply air temperature and velocity to bring PMV toward neutrality.
Modify diffuser placement to reduce local overcooling or overheating.
Reposition return vents to promote uniform air mixing.
Add local control zones (VAV systems) for variable load conditions.
Balance radiant and convective components for more consistent comfort.
The design objective is to maintain PMV within –0.5 ≤ PMV ≤ +0.5 throughout the occupied zone.
7. Relationship Between PMV and Other Comfort Indices
PMV is often evaluated alongside:
Predicted Percentage of Dissatisfied (PPD): quantifies how many occupants are likely uncomfortable at a given PMV.
Draft Rate (DR): identifies discomfort due to excessive air movement.
A well-balanced HVAC system should maintain:
PMV between –0.5 and +0.5
PPD < 10%
DR < 20%
Together, these indices provide a complete understanding of both global and local comfort performance within the building.
8. Practical Applications
PMV distribution analysis is widely used in:
Office Buildings: ensuring consistent comfort across workspaces.
Hospitals and Laboratories: maintaining stable thermal conditions for sensitive environments.
Educational Facilities: improving comfort and focus for students.
Museums and Archives: controlling temperature and humidity for artifact preservation.
Residential and Commercial Spaces: optimizing occupant comfort with minimal energy use.
9. Conclusion
Predicted Mean Vote (PMV) distribution is an essential metric in modern HVAC design, providing a quantitative measure of occupant comfort across different zones of a building. By integrating PMV analysis into CFD simulations, designers can visualize comfort gradients, detect thermal imbalances, and optimize ventilation layouts for balanced comfort and energy efficiency.
Designing HVAC systems based on PMV distribution transforms comfort assessment from simple temperature control into comprehensive comfort engineering — ensuring that every occupant experiences a truly comfortable indoor environment.
tensorHVAC-Pro is a dedicated flow and thermal HVAC simulation software, easy to use and intuitive, designed for HVAC engineers - not CFD expert. Learn more..
Read more articles..