
HVAC Design Optimization Based on Predicted Percentage of Dissatisfied (PPD) Distribution
PPD predicts the percentage of people likely to feel thermally uncomfortable. Typical acceptable comfort range:
ARTICLES
Wiratama
10/9/20253 min read
1. Introduction
In the pursuit of optimal indoor environmental quality, HVAC (Heating, Ventilation, and Air Conditioning) systems must do more than just control temperature and airflow—they must ensure human comfort. However, even in perfectly conditioned environments, not every occupant feels comfortable.
To quantify this variability, thermal comfort research introduces the Predicted Percentage of Dissatisfied (PPD) index — a statistical measure that predicts the percentage of people likely to feel thermally uncomfortable in a given space.
By analyzing PPD distribution across a building, engineers can evaluate how evenly comfort is achieved and identify areas where HVAC performance can be improved. Using Computational Fluid Dynamics (CFD), PPD can be calculated spatially, creating a clear map of comfort zones versus discomfort regions.
2. What Is PPD?
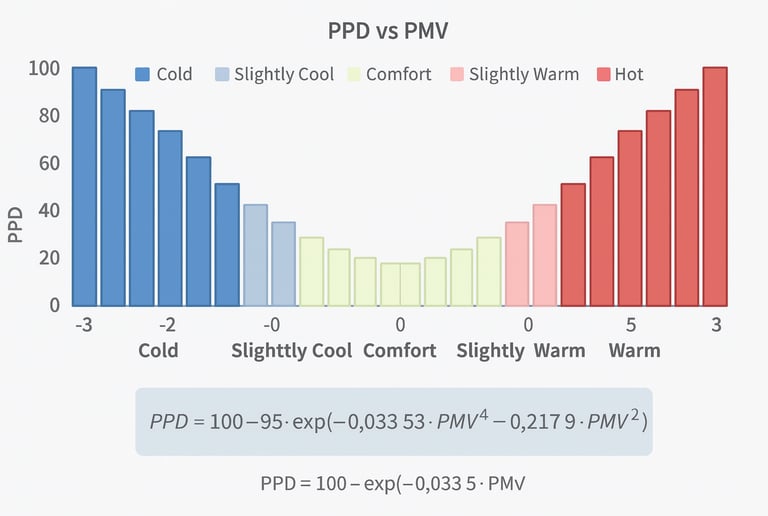
Predicted Percentage of Dissatisfied (PPD) is a comfort index that quantifies the expected proportion of occupants dissatisfied with their thermal environment. It is derived directly from the Predicted Mean Vote (PMV) index, which expresses the average thermal sensation of a group.
This curve shows that even under ideal thermal conditions (PMV = 0), at least 5% of people remain dissatisfied — reflecting individual variation in comfort perception.
3. Interpreting PPD Values
The PPD index ranges from 5% to 100%, with lower values representing higher comfort levels.

The goal of HVAC design is to maintain:
PPD ≤ 10% in the occupied zone
Corresponding PMV between –0.5 and +0.5
This range ensures that at least 90% of occupants experience satisfactory thermal comfort — a key benchmark in ISO 7730 and ASHRAE Standard 55.
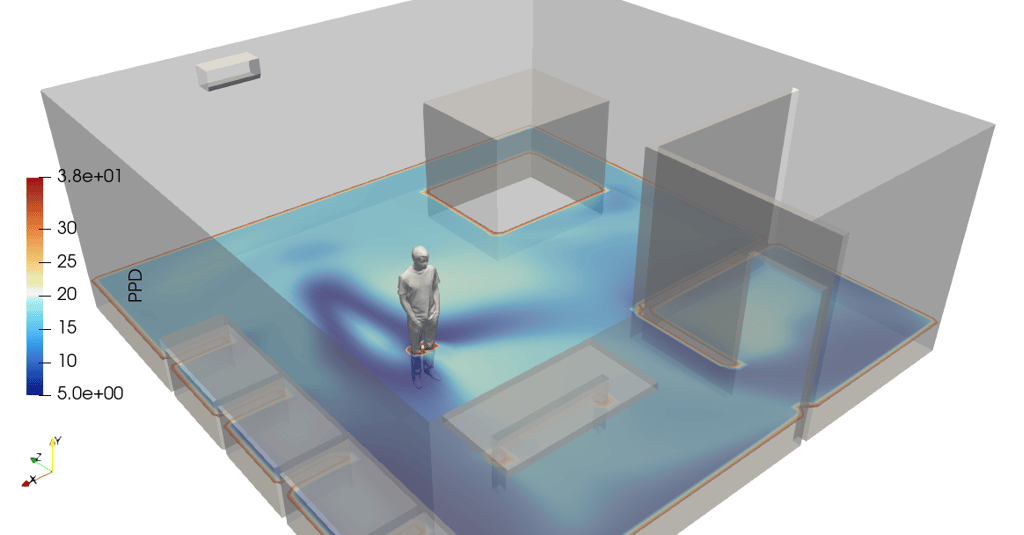
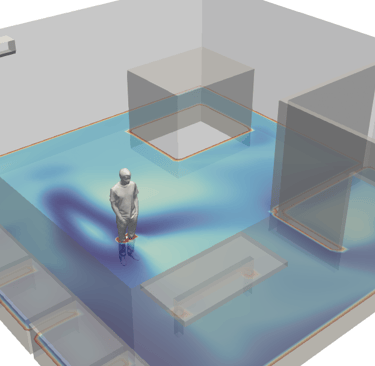
4. PPD Distribution Analysis Using CFD Simulation
Computational Fluid Dynamics (CFD) provides a powerful method to analyze how PPD varies spatially across a room or building.
CFD simulations first solve for the local air temperature, velocity, humidity, and turbulence intensity fields. These results are then used to calculate PMV at each point, and from PMV, the PPD distribution is derived using the equation above.
The result is a 3D contour map where:
Blue or green zones represent low PPD (high comfort).
Yellow to red zones represent high PPD (low comfort).
These maps provide a visual representation of where occupants are likely to experience thermal dissatisfaction, allowing engineers to evaluate HVAC performance beyond simple averages.
5. Factors Influencing PPD Distribution
Several design and environmental factors affect PPD values throughout a space:
Temperature gradients: Uneven thermal distribution increases discomfort.
Air velocity: High or low velocities influence local cooling or stagnation.
Humidity: Affects perceived temperature and evaporative cooling.
Radiant asymmetry: Warm or cold surfaces (e.g., windows, ceilings) can cause localized discomfort.
Occupant clothing and activity: Different clothing insulation (clo) or metabolic rates (met) affect PMV and PPD outcomes.
Understanding how these parameters interact helps designers create HVAC systems that achieve both energy efficiency and occupant satisfaction.
6. Design Optimization Using PPD Distribution
By evaluating PPD maps from CFD simulations, engineers can make targeted improvements:
Adjust supply air temperature to reduce overcooling or overheating zones.
Reorient diffusers to balance air velocity within the occupied zone.
Add local thermal control zones (VAV systems) to handle variable loads.
Optimize insulation or glazing to reduce radiant asymmetry.
Rebalance airflow to minimize PPD peaks near occupants or equipment.
The objective is to achieve a uniform PPD distribution within the comfort threshold (≤10%) throughout all occupied areas.
7. Relationship Between PMV and PPD
PPD is fundamentally tied to PMV, but while PMV expresses how people feel (warm, cold, or neutral), PPD expresses how many feel uncomfortable.
Together, they form the core of the Fanger comfort model, offering both qualitative and quantitative comfort assessments.
A typical relationship example:
PMV = 0 → PPD = 5% (ideal).
PMV = ±0.5 → PPD = 10% (acceptable).
PMV = ±1.0 → PPD = 25% (borderline discomfort).
CFD post-processing combining PMV and PPD contours provides a full picture of comfort performance, making it an invaluable design tool for occupant-centric HVAC systems.
8. Practical Applications
PPD distribution analysis is used extensively in:
Office buildings: Ensuring uniform comfort across workstations.
Hospitals and laboratories: Controlling patient comfort while maintaining sterile conditions.
Cleanrooms: Achieving strict environmental control with minimal discomfort.
Educational facilities: Enhancing learning environments through balanced comfort.
Residential and commercial spaces: Improving comfort and energy efficiency simultaneously.
9. Conclusion
Predicted Percentage of Dissatisfied (PPD) distribution provides an objective and quantitative measure of overall occupant comfort. When integrated with CFD simulation, it allows HVAC engineers to visualize how comfort varies throughout a space and optimize system design to minimize discomfort.
A low and uniform PPD distribution indicates a well-balanced thermal environment — where HVAC systems deliver not just controlled air, but consistent, data-driven comfort.
By designing HVAC systems based on PPD analysis, engineers move beyond traditional metrics toward precision comfort engineering, ensuring that more than 90% of occupants feel truly comfortable under real operating conditions.
tensorHVAC-Pro is a software dedicated for indoor comfort and Air Quality of a HVAC system, designed for easy to use even for non simulation expert, focus on your project success.
Read more articles..