
HVAC Design Optimization Based on Temperature Distribution
Temperature uniformity is crucial for occupant comfort and system efficiency. Uneven temperature gradients may arise from poor air mixing, equipment heat loads, or solar radiation effects.
ARTICLES
Wiratama
10/9/20253 min read
1. Introduction
In HVAC (Heating, Ventilation, and Air Conditioning) system design, maintaining the right temperature is more than just setting a thermostat value. The true measure of comfort lies in how evenly that temperature is distributed throughout a space. Uneven temperature fields lead to discomfort, energy waste, and reduced system efficiency.
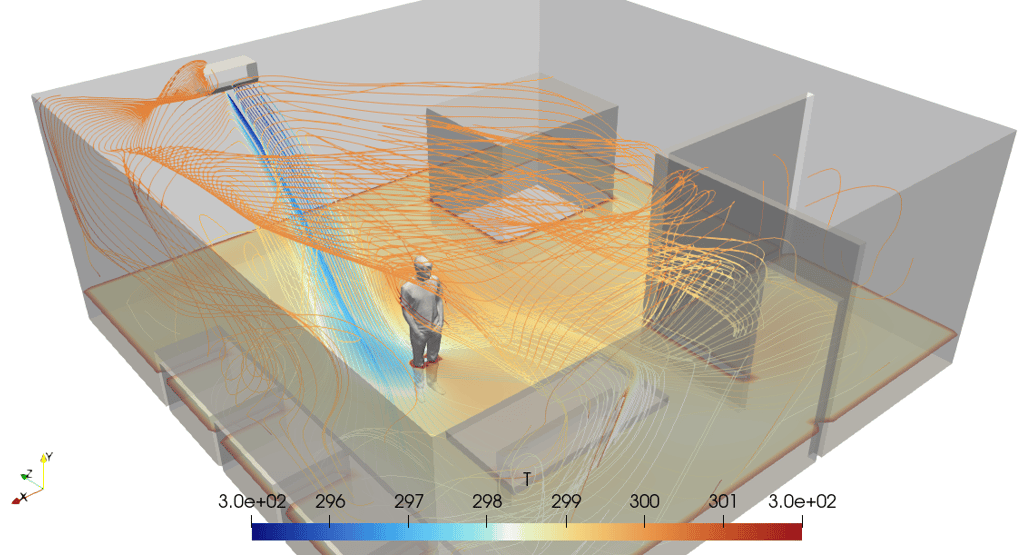
Through Computational Fluid Dynamics (CFD) simulation, engineers can visualize temperature distribution in three dimensions, identifying hot and cold zones, stratification layers, and inadequate mixing patterns. Understanding temperature distribution enables precise control of airflow and diffuser design — ensuring both comfort and energy efficiency.
2. What Is Temperature Distribution?
Temperature distribution describes how air temperature varies spatially within an enclosed environment.
It reflects how effectively the HVAC system delivers thermal energy from supply air to the occupied zone.
Uniform temperature distribution → ideal comfort and efficient mixing.
Non-uniform temperature distribution → localized discomfort, such as hot spots or cold drafts.
This distribution is influenced by several factors:
Supply air temperature and velocity.
Diffuser type and placement.
Internal heat sources (people, equipment, lighting).
Solar gains and building envelope insulation.
3. Why Temperature Distribution Matters
Even when average room temperature meets design standards (e.g., 24°C), poor distribution can lead to occupant dissatisfaction and energy inefficiency. Common problems include:
Thermal stratification: Warm air accumulating near the ceiling, cooler air near the floor.
Cold drafts: High-velocity, low-temperature air near diffusers.
Localized overheating: Near windows or electronic equipment.
By evaluating the temperature distribution, engineers can detect these issues early and optimize system design before construction or installation.
4. CFD Simulation for Temperature Distribution
Computational Fluid Dynamics (CFD) enables detailed visualization of heat transfer and air mixing within a space.
Using this equation, CFD calculates temperature fields under realistic conditions, accounting for supply air flow, heat loads, and convection effects.
5. Interpreting Temperature Distribution Results
CFD post-processing tools present temperature contours, slices, and iso-surfaces that show how heat is distributed. These visuals allow engineers to:
Identify zones of temperature imbalance or thermal layering.
Verify whether supply air adequately mixes with room air.
Compare different diffuser layouts or HVAC configurations.
Quantify temperature gradients between occupied and unoccupied zones.
For instance:
A vertical temperature gradient greater than 3°C between head and ankle level may cause discomfort.
A horizontal temperature variation exceeding 1°C across workstations can indicate poor air distribution.
6. Design Improvements Based on Temperature Distribution
Analyzing temperature fields provides actionable insights for improving HVAC design:
Diffuser Optimization: Adjust outlet geometry or orientation for better air mixing.
Return Air Placement: Prevent thermal short-circuiting by positioning return vents effectively.
Supply Air Adjustment: Modify temperature and velocity to minimize stratification.
Insulation and Heat Load Balancing: Reduce solar or equipment-induced hot spots through envelope and layout design.
The goal is to achieve thermally uniform comfort within the occupied zone (typically 0.1–1.8 m above the floor).
7. Temperature Distribution and Comfort Indices
Temperature directly affects key thermal comfort parameters, such as:
Predicted Mean Vote (PMV) – indicates average occupant thermal sensation.
Predicted Percentage of Dissatisfied (PPD) – percentage of occupants likely to feel uncomfortable.
Draft Rate (DR) – discomfort due to cold air movement.
Even small temperature gradients can shift PMV and PPD values beyond acceptable ranges. Hence, ensuring a balanced temperature distribution is essential for maintaining comfort compliance under ASHRAE 55 and ISO 7730 standards.
8. Practical Applications
Temperature distribution analysis is beneficial for many building types:
Office and commercial buildings: Ensures consistent comfort across work zones.
Cleanrooms and laboratories: Maintains controlled thermal environments for sensitive operations.
Data centers: Prevents hot spots that can damage equipment.
Hospitals and healthcare facilities: Maintains stable comfort for patients and staff.
Industrial halls or warehouses: Balances heating or cooling efficiency in large spaces.
9. Conclusion
Temperature distribution is a key determinant of indoor comfort and HVAC performance. A design that achieves the target setpoint temperature but exhibits uneven thermal distribution can still lead to discomfort and energy waste.
By leveraging CFD simulation, HVAC engineers can visualize and quantify temperature fields, identify problem zones, and implement design improvements that enhance both thermal comfort and energy efficiency.
Designing HVAC systems based on temperature distribution transforms conventional practice into precision comfort engineering — ensuring every part of a building receives balanced, well-conditioned air.
tensorHVAC-Pro
tensorHVAC-Pro is a software dedicated for indoor comfort and Air Quality of a HVAC system, designed for easy to use even for non simulation expert, focus on your project success.