
Post-Processing in tensorHVAC-Pro
How to do post-processing (generating data and plots) in tensorHVAC-Pro using paraView
USER-GUIDE
10/7/20251 min read
Post-Processing in tensorHVAC-Pro
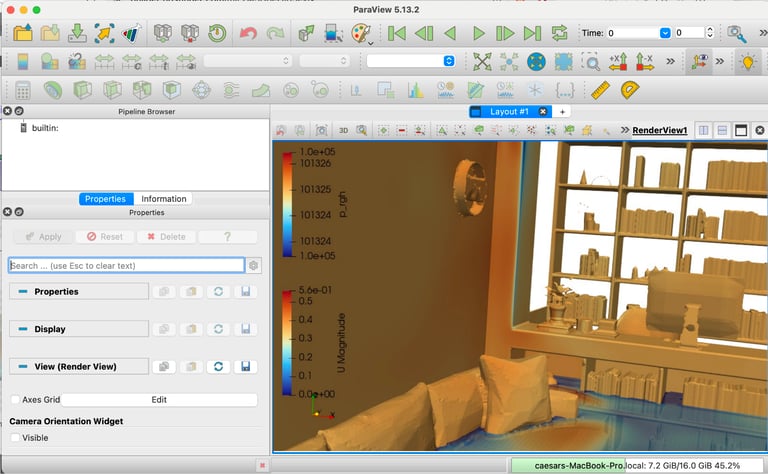
After completing a simulation in tensorHVAC-Pro, all post-processing tasks are performed using ParaView, a powerful open-source visualization tool. ParaView allows users to load simulation outputs and explore key results such as velocity, temperature, pressure, PMV, PPD, Draft Rate (DR), and air age. These fields can be visualized using a variety of techniques to better understand airflow patterns and indoor comfort conditions.
To inspect specific regions of interest, users can create Section Planes to view cross-sectional slices of the room and observe how quantities vary across different heights or locations. ParaView also supports the generation of Streamlines, which help visualize flow trajectories and identify circulation zones, stagnation areas, and high-velocity paths within the domain. For mesh inspection or solver debugging, the Wireframe view mode can be enabled to display cell topology directly.
For improved contour quality, users can apply the “Cell Data to Point Data” filter. This converts cell-centered values into point-based values, allowing smoother gradients and more visually refined contour plots—especially useful when presenting velocity, temperature, or comfort metrics.
With these post-processing tools, tensorHVAC-Pro enables users to thoroughly analyze HVAC performance and make informed engineering decisions based on high-quality visual insights.